|
National Teen Driving Statistics
Motor vehicle crashes are the leading cause of death among 15- to 20-year olds, according to the National Center for Health Statistics. National studies of graduated licensing found that strong laws were associated with substantially lower fatal crash rates and substantially lower insurance claim rates among young teen drivers covered by the laws. Strong restrictions on nighttime driving and teen passengers, as well as raising the licensing age, reduced rates of fatal crashes and insurance collision claims.
According to the Insurance Institute for Highway Safety:
- A total of 2,476 teenagers ages 13-19 died in motor vehicle crashes in 2018. This is 72 percent fewer than in 1975 and 10 percent fewer than in 2017.
- About 2 out of every 3 teenagers killed in crashes in 2018 were males. Since 1975 teenage crash deaths have decreased more among males (76 percent) than among females (59 percent).
- In 2018, teenagers accounted for 7 percent of motor vehicle crash deaths. They comprised 8 percent of passenger vehicle (cars, pickups, SUVs, and vans) occupant deaths among all ages, 4 percent of pedestrian deaths, 3 percent of motorcyclist deaths, 7 percent of bicyclist deaths and 25 percent of all-terrain vehicle rider deaths.
- Seventy-eight percent of teenage motor vehicle crash deaths in 2018 were passenger vehicle occupants. The others were pedestrians (10 percent), motorcyclists (6 percent), bicyclists (3 percent).
- In 2018, 63 percent of deaths among passenger vehicle occupants ages 16-19 were drivers.
- In 2018, teenage crash deaths occured most often in July; May, June, September and October also saw elevated crash deaths among teens.
- Fifty-two percent of motor vehicle crash deaths among teenagers in 2018 occurred on Friday, Saturday or Sunday.
- Teenage motor vehicle crash deaths in 2018 occurred most frequently from 9:00 p.m. to midnight (18 percent).
- In 2018, 75 percent of the deaths of teenage passengers in passenger vehicles occurred in vehicles driven by another teenager. Among deaths of passengers of all ages, 12 percent occurred when a teenager was driving.
- In 2018, belt use among fatally injured passenger vehicle drivers age 16 (53 percent), 17 (50 percent), and 18 (50 percent) was higher than among fatally injured drivers age 19 (44 percent) and those ages 20-59 (42 percent), but lower than among drivers 60 and older combined (64 percent). Among fatally injured 16-19 year old occupants, belt use among passangers (34 percent) was considerably lower than among drivers (48 percent). Note, that belt use among those fatally injured is not always accurately recorded but it gives an indication of relative belot use rates in serious crashes by age group.
- Among passenger vehicle drivers ages 16-19 involved in fatal crashes in 2018, 42 percent were involved in single-vehicle crashes. This was higher than for drivers ages 25 and older (35 percent).
- Among fatally injured teenage drivers in 2018, females were less likely than males to have high BACs. Among fatally injured passenger vehicle drivers ages 16-17, 20 percent of males and 9 percent of females had BACs at or above 0.08 percent. Among fatally injured drivers ages 18-19, 24 percent of males and 17 percent of females had BACs at or above 0.08 percent.
- The AAA Foundation for Traffic Safety released a report in May 2012 that showed that the risk of 16- or 17-year old drivers being killed in a crash increases with each additional teenage passenger in the vehicle. The risk increases 44 percent with one passenger; it doubles with two passengers, and quadruples with three or more passengers. The study analyzed crash data and the number of miles driven by 16- and 17-year olds.
Colorado Teen Driving Statistics
According to the Colorado Department of Public Health and Environment:
-
Between 2005 and 2016, Colorado averaged 64 young drivers involved in fatal crashes per year. In 2017 and 2018, the average was 86 young drivers per year, an increase of 34%, according to to CDOT. Teen drivers' inexperience makes them among the most dangerous drivers on the road.
| Target Group |
2004 |
2005 |
2006 |
2007 |
2008 |
2009 |
2010 |
2011 |
2012 |
2013 |
2014 |
2015 |
2016 |
| Drivers 20 and younger involved in fatal crashes |
107 |
65 |
64 |
61 |
48 |
43 |
39 |
36 |
40 |
41 |
35 |
34 |
49 |
- In 2016, Inexperience was the contributing factor in 26% of all injury and fatal crashes involving a teen driver ages 15-19. (And 34% on non-injury crashes, property damage only).
- Teens represented 4% of licensed Colorado drivers in 2016 but accounted for 7% of drivers in fatal crashes and 11% of drivers in all traffic crashes.
- A 2013 survey of 738 parents of teens throughout Colorado showed only 6.4 percent of parents could accurately identify components of graduated drivers licensing laws, including curfews, passenger restrictions and seat belt requirements.
Distraction and Teen Crashes
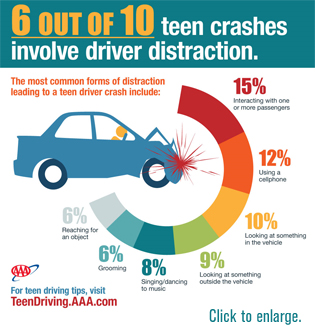 The most comprehensive research ever conducted into crash videos of teen drivers has found significant evidence that distracted driving is likely much more serious a problem than previously known, according to the AAA Foundation for Traffic Safety. The unprecedented video analysis finds that distraction was a factor in nearly 6 out of 10 moderate-to-severe teen crashes. The most comprehensive research ever conducted into crash videos of teen drivers has found significant evidence that distracted driving is likely much more serious a problem than previously known, according to the AAA Foundation for Traffic Safety. The unprecedented video analysis finds that distraction was a factor in nearly 6 out of 10 moderate-to-severe teen crashes.
Researchers analyzed the six seconds leading up to a crash in nearly 1,700 videos of teen drivers taken from in-vehicle event recorders. The results showed that distraction was a factor in 58 percent of all crashes studied, including 89 percent of road-departure crashes and 76 percent of rear-end crashes. Click here for the full AAA news release.
The most common forms of distraction leading up to a crash by a teen driver included:
- Interacting with one or more passengers: 15 percent of crashes
- Cell phone use: 12 percent of crashes
- Looking at something in the vehicle: 10 percent of crashes
- Looking at something outside the vehicle: 9 percent of crashes
- Singing/moving to music: 8 percent of crashes
- Grooming: 6 percent of crashes
- Reaching for an object: 6 percent of crashes
IIHS Recommendations on Used Vehicles for Teens
According to new research by the Insurance Institute for Highway Safety (IIHS), many teenagers are driving vehicles that don't offer good crash protection and lack important safety technology. To help guide parents toward safer choices, IIHS has compiled its first-ever list of recommended used vehicles for teens.
In a national survey of parents of teen drivers, 83 percent of those who bought a vehicle for their teenagers said they bought it used. With that reality in mind, the IIHS has compiled a list of affordable used vehicles that meet important safety criteria for teen drivers.
A separate IIHS study shows that teenagers killed in crashes are more likely than adults to have been behind the wheel of small vehicles and older vehicles. Among fatally injured drivers ages 15-17 in 2008-12, 29 percent were in minicars or small cars, while 20 percent of fatally injured drivers ages 35-50 were. Eighty-two percent of the young teen drivers were in vehicles that were at least 6 years old, compared with 77 percent of those in the adult group.
The recommendations on teen vehicle choice are guided by four main principles:
- Young drivers should stay away from high horsepower. Vehicles with more powerful engines can tempt them to test the limits.
- Bigger, heavier vehicles protect better in a crash. There are no minicars or small cars on the recommended list. Small SUVs are included because their weight is similar to that of a midsize car.
- ESC is a must. This feature, which helps a driver maintain control of the vehicle on curves and slippery roads, reduces risk on a level comparable to safety belts.
- Vehicles should have the best safety ratings possible. At a minimum, that means good ratings in the IIHS moderate overlap front test, acceptable ratings in the IIHS side crash test and four or five stars from the National Highway Traffic Safety Administration (NHTSA).
Click here to view the IIHS list of recommended used vehicles for teens.
|
